
Quebec Premier François Legault has just launched a major initiative to “electrify Quebec” and position his province as the “green battery of North America” with its potential to sell hydroelectricity to Ontario and New York. Such initiatives are driven by Quebec producing plentiful and relatively cheap power. The cost side of the equation is always well-publicized by Hydro Quebec in its annual Comparison of Electricity Prices in Major North American Cities report. For more than a decade, the report has crowned Montreal as the jurisdiction with the lowest residential electricity bills among 21 chosen peers in Canada and the U.S. While other cities –including Winnipeg, Vancouver, and Seattle – have competitive commercial and industrial rates, Hydro Quebec reigns supreme in the residential category. According to Hydro Quebec’s analysis, the residential electricity bill for a household that consumes 1,000 kWh in Montreal is about half of that in Toronto and Edmonton, and 60 per cent of what households pay in hydro power-rich Vancouver. But with everything else that comes with energy pricing, the devil is in the details, which are often listed in the small print on our bills. An apples-to-apples comparison of electricity costs across cities requires consideration of these details. We provide such a comparison here for households in Ontario and in Quebec to better understand the overall energy advantage.
The Hydro Quebec report offers a useful comparison of household electricity rates across jurisdictions, but it does not pay close attention to how typical consumption levels vary by city, or usage of different energy fuels such as natural gas, which together contribute to total energy bills for a province’s homeowners. Table 1 depicts the monthly bill information provided in the 2018 report as part of the Detailed Tables for Residential Ratepayers. It is worth noting that only Toronto and Ottawa are provided as Ontario comparators and that five consumption levels are considered. From looking at the middle column, which estimates household bills based on consumption at 1,000 kWh/month, it appears Toronto households pay 86 per cent more for electricity than those in Montreal. Hydro Quebec’s advantage drops for higher-consuming households – at 2,000 kWh/month, Toronto households pay 40 per cent more than in Montreal.
Table 1 Hydro Quebec's residential monthly bills table ($)
|
Consumption |
625 |
750 |
1,000 kWh |
2,000 kWh |
3,000 kWh |
| Montreal, QC | 49.13 | 56.52 | 71.29 | 159.52 | 251.12 |
| Calgary, AB | 108.13 | 124.71 | 157.87 | 290.51 | 423.14 |
| Charlottetown, PE | 114.38 | 132.35 | 168.27 | 311.97 | 426.17 |
| Edmonton, AB | 98.67 | 113.61 | 143.48 | 262.97 | 382.46 |
| Halifax, NS | 106.65 | 125.81 | 164.14 | 317.45 | 470.76 |
| Moncton, NB | 89.16 | 102.68 | 129.70 | 237.80 | 345.90 |
| Ottawa, ON | 83.34 | 96.09 | 121.57 | 223.51 | 325.46 |
| Regina, SK | 111.72 | 129.50 | 165.07 | 307.35 | 449.63 |
| St. John's, NL | 81.13 | 94.19 | 120.29 | 224.72 | 329.14 |
| Toronto, ON | 94.29 | 106.98 | 132.36 | 233.90 | 335.43 |
| Vancouver, BC | 64.26 | 79.34 | 114.15 | 253.38 | 392.61 |
| Winnipeg, MB | 59.31 | 69.55 | 90.04 | 172.00 | 253.96 |
Source: Hydro Quebec - Comparison of Electricity Prices in Major North American Cities (2018 Edition, page 33).
The two provinces’ pricing structures for electricity explain some of this differential in household bills. Both include a fixed charge and a variable charge based on monthly electricity consumption. Ratepayers across Quebec’s major municipalities pay the same rate, while electricity bills in Ontario vary significantly depending upon the local distribution company (LDC) serving a particular city. While the fixed component is important in the overall bill (more so in Ontario than Quebec), the variable charge makes the contrast between the two provinces particularly interesting. Ontario households face a time-of-use pricing structure for three daily time periods: Off-Peak ($0.065/kWh), Mid-Peak ($0.094/kWh), and On-Peak ($0.134/kWh). The average Ontario consumer spends 65 per cent during Off-Peak hours, 18 per cent during Mid-Peak, and 17 per cent during On-Peak. On the other hand, Hydro Quebec operates a tiered-pricing structure for the variable share of customer rates, where households are charged $0.0608/kWh for the first 1,200 kWh used in a month and then $0.0938/kWh for any consumption above that point. This explains the larger jump for Montreal from 1,000 kWh to 2,000 kWh in Table 1.
Ontario’s electricity rates are higher than in Quebec, but the impact on household bills is mitigated by Quebec’s higher levels of electricity consumption, driven primarily by two factors: a colder climate than Ontario, and a greater prevalence of electric rather than natural gas home heating.
Meteorologists capture climate differences with a measure called ‘heating degree days’ (HDD), which is the number of degrees that a day’s average temperature is below 18Co, the temperature below which homes need to be heated. Figure 1 depicts the total heating degree days in 2018 for the five largest cities in Quebec and Ontario.[1] Toronto had just less than three-quarters of the heating degree days of Quebec City.
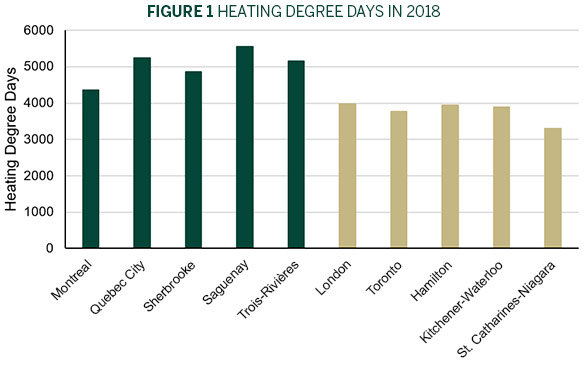
Source: Environment and Climate Change Canada.
Given the abundance of cheap, hydro-generated electricity in Quebec, households primarily employ electric home heating systems rather than natural gas. Only five per cent of Quebec households rely on natural gas for home heating – compared to 68 per cent for Ontario households. Figure 2 demonstrates the dramatic differences in the heating sources employed by households in the five largest cities in Quebec and Ontario.
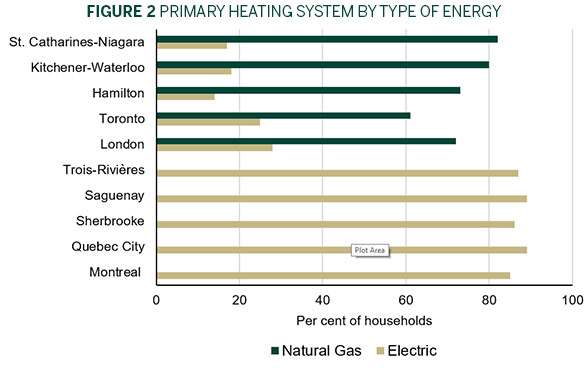
Source: Statistics Canada, CANSIM 153-0145.
Given the differences between Ontario and Quebec households in climate conditions and home heating fuels, it is logical to expect that the average Quebec household uses significantly more electricity than in Ontario and vice versa with respect to natural gas. According to Statistics Canada, the average Ontario household consumes 722 kWh of electricity and 203 m3 of natural gas per month. While this provincial-level data is informative, the cross-city variation in Ontario is substantial: based on data reported by the LDCs in Ontario, most urban households consume closer to 600 kWh of electricity per month. On the other hand, the average Quebec household consumes more than double the amount of electricity at 1,550 kWh per month, and if it relies on natural gas for heating, it consumes 134 m3 per month. However, given that so few Quebec households use natural gas, this figure is not useful for our apples-to-apples comparison. Nevertheless, differences in natural gas rates for households between Ontario and Quebec are just as stark as for electricity, but now favouring Ontario. In 2019, a household using 170 m3 per month (the midpoint of average consumption across the two provinces) pays 63 per cent less for natural gas in Toronto compared to a similar household in Montreal.
Figure 3 presents estimates of overall household energy bills in Ontario and Quebec, combining electricity and natural gas costs, using utility-level data provided by Lazlo Energy Services. Given that Hydro Quebec has a common rate structure across its major municipalities, we only consider Montreal for this analysis and exclude natural gas given its low penetration in Quebec. In Panel A, below, we consider the Hydro Quebec electricity bills at the provincial average (1,550 kWh), and for cities in Ontario we consider the average electricity consumption reported by the local LDC and the provincial average for natural gas use. In Panel B, below, we do the same but increase household energy consumption by 20 per cent. Clearly, Hydro Quebec’s cost advantage continues to dominate, but it is worth recalling that the table depicted in the Hydro Quebec report had differences in some bills at more than 85 per cent. When you dig into the details, however, and try to make a more representative comparison that captures the total energy bill, as depicted in Panel A, the difference drops to 38 per cent for London, 41 per cent for both Hamilton and St. Catharines-Niagara, 34 per cent for Kitchener-Waterloo, and 58 per cent for Toronto. On a dollar basis, monthly household energy bills for these Ontario cities are about $50 higher than in Montreal. These are much less than the 85-per-cent+ premiums stated in Hydro Quebec’s report. The Quebec advantage further dissipates for households consuming 20 per cent more energy than the average — the cost differentials in London, Hamilton, Kitchener-Waterloo, and St. Catharines-Niagara drop to about 25 per cent, and 40 per cent in Toronto.
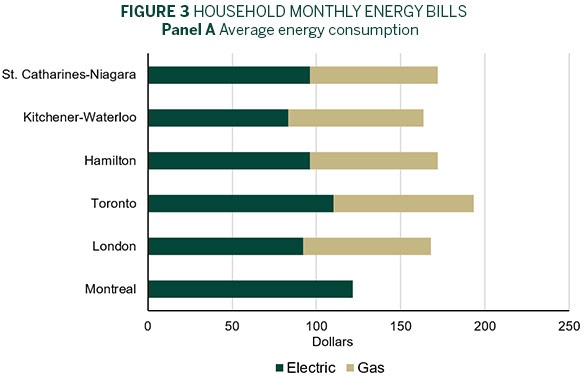
Source: Author’s calculation using data from Laszlo Energy Services.
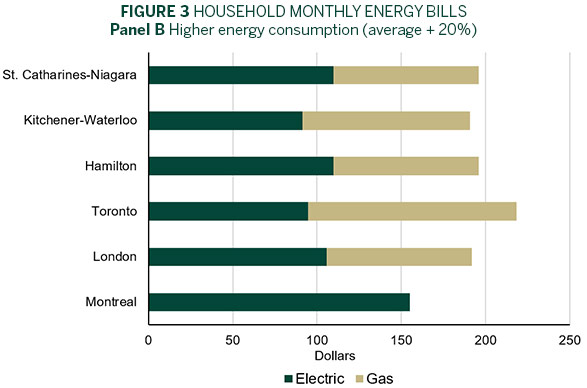
Source: Author’s calculation using data from Laszlo Energy Services.
There is no question electricity is cheaper in Quebec than in Ontario and household energy bills, including both electric and natural gas, are lower as a result. Our more representative comparison, however, highlights how the difference is not as great as the Hydro Quebec report depicts. Furthermore, the reference in its report to energy bills in Toronto can be misleading, as bills for Toronto households are 15 per cent higher than nearby Ontario cities. Finally, this comparison highlights best the power of natural gas as a low-priced energy source, to offset Ontario’s higher- priced electricity. Ontario has benefitted from historic low natural gas prices over the last decade and its geographic locational advantage that gives access to North America’s most prolific natural gas supply basins. We should remember that electricity rates are just one component of overall household energy bills.
[1] We have omitted Ottawa-Gatineau from this depiction given that it is a major urban centre for both provinces that spans jurisdictional boundaries.